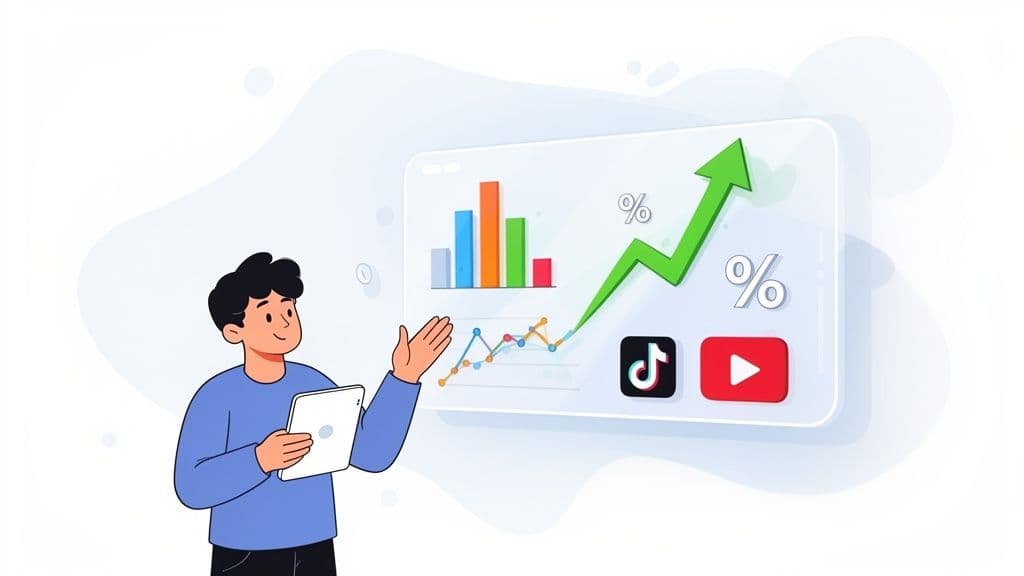
Measuring content performance is all about tying your creative work back to real business results. It’s a process of defining what you want to achieve, picking the right Key Performance Indicators (KPIs)—like engagement rate or conversions—and then digging into platform-specific metrics to see how you’re doing. This is how you move past just counting views and start understanding what actually works.
Moving Beyond Vanity Metrics in Content Performance
Let's be honest—chasing view counts can feel like running on a treadmill. You see a big number, but what does it really mean for your business? True growth comes from understanding what actually connects with your audience and drives them to act.
A viral video is exciting, but it doesn't tell the whole story. What if most viewers bounced after three seconds? What if they never commented, shared, or clicked through to your site? This is the classic trap of relying on vanity metrics.
To really get a handle on your content's performance, you need to shift your focus from superficial numbers to insights you can actually use. This guide will walk you through a framework that connects every piece of content you create back to a meaningful business goal. Instead of just asking, "How many people saw this?" we're going to start asking much better questions:
- Did this content grab and hold people's attention?
- Did it spark conversation and help build a community?
- Did it actually get someone to take the next step?
This process always starts with a clear goal, which then informs the KPIs and specific metrics you'll need to track.

As you can see, effective measurement isn't an afterthought; it's baked into the strategy from the very beginning.
Why Actionable Insights Matter More Than Views
On fast-moving platforms like TikTok, metrics like watch time, saves, and shares tell a much more compelling story than simple views or likes. A high completion rate shows that your hook and storytelling were strong enough to keep someone watching—a massive signal to the algorithm.
Shares are even more powerful. They mean your content was so valuable that someone put their own reputation on the line to pass it along, giving you organic reach that money can't buy. These are the kinds of metrics that fuel real, sustainable growth. You can dive deeper into these concepts with our guide on effective social media growth strategies.
The goal is to move from passive observation to active analysis. Your analytics shouldn't just be a report card; they should be your playbook for what to create next.
This mindset shift turns your data from a simple scoreboard into a strategic tool, ensuring every ounce of creative energy you spend delivers measurable results and contributes to your brand's bottom line.
Defining What Success Looks Like for Your Content
Before you even glance at a dashboard, you have to answer a fundamental question: what does a "win" actually look like for this content? Without a clear definition of success, you're just staring at numbers in a vacuum. It’s the difference between collecting data and actually using it.
Vague goals like "more engagement" or "better reach" are just wishful thinking. They won't get you anywhere. To get real results, you need to set objectives that are precise and actionable. This is where the classic S.M.A.R.T. goal framework is so valuable—it forces you to be Specific, Measurable, Achievable, Relevant, and Time-bound.

Using this framework takes you from a fuzzy ambition to a concrete target. For instance, a creator wanting "more engagement" might reframe that as a S.M.A.R.T. goal: increase their average comment rate by 15% over the next quarter to build a more active community. Now that's a target you can actually track and work toward.
From Broad Goals to Specific KPIs
Once you have a clear objective, the next step is to translate it into Key Performance Indicators (KPIs). Think of KPIs as the specific, measurable signposts that tell you if you're on the right track to hitting your goal.
Let's look at how this plays out in the real world:
- Your Goal: You want to increase brand awareness with a new audience.
- Your KPIs: You'd be watching Impressions, Follower Growth Rate, and maybe even Branded Search Volume. These metrics tell you if more people are actually seeing and searching for your brand.
- Your Goal: You need to drive more qualified leads for your sales team.
- Your KPIs: Here, you'd focus on Form Submissions, Conversion Rate from your blog, and the Click-Through Rate (CTR) on your calls-to-action. These KPIs are directly tied to lead generation.
- Your Goal: You want to build a loyal community, not just a following.
- Your KPIs: This is where you look at things like Comment Rate, Shares per Post, and Saves. These actions signal a much deeper connection than a simple like or view.
It's all about looking past the vanity metrics and focusing on what truly drives your business forward, which is a key part of measuring influencer marketing ROI and other campaigns.
Imagine a DTC brand launching a new TikTok campaign with the primary goal of driving sales. A weak goal is "get more sales from TikTok." A powerful S.M.A.R.T. goal is: "Drive a 5% conversion rate from our Q3 TikTok ad campaign, resulting in at least 200 sales by the end of September." See the difference? It’s specific, measurable, relevant, and has a deadline.
By setting these laser-focused goals upfront, you lay a solid foundation for your entire measurement strategy. Every metric you track has a purpose, and every piece of content you create has a clear job to do. This clarity is what separates aimless content creation from a strategic, performance-driven approach.
Choosing the Right Metrics for Your Platform
Every social media platform has its own dialect. The way you measure success needs to be fluent in that specific language. What signals a home run on a 20-minute YouTube deep dive is completely different from what makes a 15-second TikTok go viral. If you want a real picture of your performance, you have to measure your content in its native habitat.
One of the biggest mistakes I see is when creators apply a one-size-fits-all approach—like obsessing over view count across every single channel. On platforms designed for rapid-fire scrolling, like TikTok or Instagram Reels, a "view" can be incredibly fleeting. The real story isn't just that you stopped the scroll, but that you held their attention.
This is especially true with short-form video, where the algorithm is the ultimate gatekeeper. Platforms like TikTok are constantly searching for signals that a piece of content is worth serving up to more people. Your job is to feed it the right signals by tracking the right metrics.
Decoding Success on Short-Form Video Platforms
For a platform like TikTok, you need to look past the vanity metrics. Two of the most powerful indicators I rely on are Completion Rate and Engagement Rate by View. These tell you so much more than likes and comments alone; they give you a direct look at how people are actually connecting with your work.
- Completion Rate: This is simple: what percentage of people watched your video all the way through? A high completion rate is one of the most powerful green lights you can send the algorithm. It screams, "This content is so good, people can't look away."
- Engagement Rate by View: This calculates your total likes, comments, and shares as a percentage of your total views. It answers the most important question: of all the people who saw your video, how many were compelled to do something?
When you see a video with a high engagement rate that used a certain hook or editing trick, that’s your sign. You’ve found a format that works, and you now have the data to confidently replicate that creative strategy. You can dive deeper into this by using a TikTok engagement rate calculator.
Simply put, a high completion rate gets your video seen, but a high engagement rate gets it shared. You need both to build real momentum and figure out what’s truly hitting the mark.
Tracking these specific metrics helps you see your content the way the algorithm sees it. It’s the difference between knowing what worked and understanding why it worked.
Setting Realistic Benchmarks for TikTok
Okay, so you know what to track. But what does "good" actually look like?
Engagement Rate by View is a fantastic performance yardstick because it shows how effective your video is with the audience it reaches. According to recent data, the median engagement rate by view on TikTok hovers around 4.15%. Of course, this number can swing wildly depending on your niche.
For example, top-tier accounts in categories like sports can see engagement rates as high as 9.7%—more than double the median. This just goes to show how much a highly-specific, tailored hook can drive interaction. For brands, the median engagement rate per follower was a whopping 5.7%. That’s a staggering 12 times higher than the next-best platform, Instagram, which really speaks to TikTok’s power to build community. You can dig into more of these numbers in the full TikTok benchmark report.
These aren't just vanity numbers; they’re your baseline. If your engagement is consistently falling short of these benchmarks, that's a clear signal. It’s time to start experimenting with new hooks, different formats, or stronger calls-to-action to grab your audience and keep them there.
Building a Practical Content Performance Dashboard
Let's be honest, raw data is overwhelming. Staring at a spreadsheet packed with numbers is just noise until you give it some structure—until you make it tell a story. This is precisely why a simple, centralized dashboard is your single most important tool for measuring content performance.
Forget about tracking every vanity metric under the sun. The goal isn't to log everything; it's to track the right things. A good dashboard gives you a clean, at-a-glance summary that lets you spot trends, see which content pillars are popping off, and make smarter creative calls without getting bogged down in the weeds.
You don't need fancy software to get started. Seriously, a basic Google Sheet or a Notion page is more than enough. The magic is in how you structure it to answer your most pressing questions quickly.
Designing Your Dashboard Structure
The smartest way to build your dashboard is to organize it around your core content pillars or campaign themes. This structure is crucial because it ensures you’re comparing apples to apples, making it obvious which topics and formats are actually connecting with your audience.
So, instead of just lumping all your video data into one massive, unreadable list, try setting up your dashboard with clear columns that map directly to your main KPIs.
Here’s a simple but powerful layout I’ve used before:
- Content Pillar/Theme: What's the main topic? (e.g., "Product Tutorial," "Behind the Scenes").
- Hook/Format: How did you frame it? (e.g., "Problem/Solution Hook," "Day in the Life").
- Views: The raw view count.
- Completion Rate: What percentage of people watched the whole thing?
- Shares: How many people felt it was valuable enough to pass along?
- Comments: Is it sparking a conversation?
- Conversion Metric: Clicks, sign-ups, sales—whatever your end goal is.
This kind of setup helps you spot patterns almost immediately. You might look at your sheet and realize your "Behind the Scenes" content pulls a 20% higher completion rate than your standard product tutorials. Boom—that's a clear signal for what to create next.
You can pull most of this data directly from the native analytics on each platform. For example, the TikTok analytics dashboard gives you a pretty deep look at how your videos are doing and who's watching them.

This kind of view is perfect for a quick health check on your channel, showing you key metrics like video views, profile views, and follower growth over time.
A dashboard’s real job is to transform isolated data points into a story you can act on. It needs to tell you what's working, what's a flop, and—most importantly—what you should do about it.
I've found that manually plugging this data into my dashboard each week is actually a blessing. It forces me to sit with the numbers and really see them, which makes me much more in tune with small but important shifts in performance. This focused ritual means less time stuck in analysis paralysis and more time creating content that actually works.
Turning Your Analytics into Smarter Content
Okay, your dashboard is live and data is rolling in. This is where the magic happens. It’s the moment measurement stops being a chore and starts acting as your most valuable creative director. We're moving past just watching numbers and starting to ask the most important question: "So what?"

This is all about translating that raw data into real-world improvements for your next video, article, or campaign. The insights you pull out become the blueprint for what comes next, letting you make creative calls based on solid evidence, not just a gut feeling.
Conducting a Quick Content Audit
The best way to start making sense of everything is with a quick content audit. Just scan your performance dashboard and start sorting your content into three simple buckets. This is the fastest way to spot the patterns.
- Top Performers: These are your absolute home runs. They probably have stellar completion rates, tons of shares, and are crushing your conversion goals. Don't just pop the champagne—dissect them. What hooks, topics, formats, or even sounds did they use?
- Middle of the Pack: This stuff did… fine. It didn't tank, but it didn't exactly go viral either. Maybe it got decent views but low engagement, or a solid click-through rate but terrible watch time. These pieces are often hiding major clues for small tweaks that could make a huge difference.
- Underperformers: These are the pieces that just fell flat. But they’re not failures; they're your best teachers. Was the hook too slow? Was the topic a little too niche? The "why" behind their poor performance is just as crucial as understanding why your best content succeeded.
This simple sorting exercise quickly shows you what your audience actually cares about. To really level up, a deep dive into TikTok creator analytics can help translate all this raw data into some seriously powerful growth strategies.
Finding the 'Why' Behind the Numbers
Let's walk through a real-world example. Say you notice one of your TikToks absolutely crushed it with an 80% completion rate, while two other similar videos couldn't even break 30%. Looking closer, you see the top video used a trending audio track with a "day in the life" format. The other two used original audio and were basically straightforward product demos.
The insight here is glaringly obvious. Your audience connects way more with relatable, story-driven content that feels natural on the platform, not a hard sales pitch.
Your analytics don't just tell you what happened; they whisper clues about why it happened. Your job is to listen closely and turn those whispers into your next winning strategy.
When it comes to short-form video, many creators call Completion Rate the "king of TikTok metrics." It’s the ultimate signal to the algorithm that your video is worth showing to more people. As a rule of thumb, you should be aiming for 80%+ for clips under 15 seconds and 60%+ for videos between 15-30 seconds.
Running Small Experiments to Refine Your Strategy
Once you have a hunch, it's time to put it to the test. You don’t need some massive A/B testing budget; you just need to be deliberate. Start running small, controlled experiments to see if your theories hold water.
- Test different calls-to-action (CTAs). Try a direct "Link in bio" against a softer "What do you think? Let me know in the comments." See which one actually drives the action you want.
- Experiment with video length. If your 15-second videos have killer completion rates, could a 12-second version push that rate even higher? Give it a shot.
- Play with hooks. On a similar topic, test a question-based hook against a bold, declarative statement. Which one stops the scroll more effectively?
By constantly analyzing, forming a hypothesis, and testing, you create an incredibly powerful feedback loop. This cycle is the secret to mastering content performance and building a strategy where every new piece of content is smarter than the last. It’s also a fantastic way to spark ideas for our content repurposing strategies.
Got Questions? We've Got Answers
Diving into content analytics can feel like learning a new language. It's totally normal to have questions pop up along the way. To help you out, I've put together some straightforward answers to the questions I hear most often from creators and brands.
Think of this as your go-to cheat sheet for getting over those common hurdles and refining your measurement process.
How Often Should I Be Checking My Content Analytics?
I get it. You just posted something great, and the urge to refresh your stats every five minutes is real. But honestly, that kind of obsessive checking does more harm than good. Content needs time to find its legs, especially on platforms where algorithms are doing the heavy lifting.
A healthier, and far more effective, approach is to set a specific schedule for checking in. This keeps you from making knee-jerk decisions based on data that's still fresh out of the oven.
Here's a rhythm that works wonders:
- A Weekly Pulse-Check: Take a quick look to see what's bubbling up. This is perfect for spotting early trends or identifying a piece of content that's taking off unexpectedly. You're just looking for quick, tactical insights.
- A Monthly Deep-Dive: Block out some real time for this one. This is where you measure your performance against the KPIs you set and make bigger, more strategic decisions for the month ahead.
This cadence gives your content enough time to mature, so the numbers you're looking at actually mean something. It helps you see the whole picture, not just a single, blurry snapshot.
Remember, the point of checking analytics isn't just to watch numbers go up. It's to gather enough meaningful data to confidently decide what to do next.
As a New Creator, What's the Single Most Important Metric?
When you're just starting out, it's so easy to get fixated on your follower count. But that number is a classic vanity metric. For new creators, the most crucial numbers are the ones that prove you're building a genuine connection, not just a big audience.
You need to focus on metrics that show you're building an actual community. These are the numbers that signal you have real, long-term growth potential.
I always tell new creators to zero in on these three:
- Watch Time / Completion Rate: Are people actually sticking around to watch your whole video? This is a massive signal to the algorithm that your content is genuinely engaging.
- Comments: Comments are a direct line to your audience. They show you're starting conversations and building real relationships, which is so much more valuable than a passive "like."
- Saves: When someone saves your post, they’re telling you it's so valuable they want to come back to it later. This is one of the strongest indicators that you're creating high-quality, useful content.
Nailing these engagement metrics helps you build a loyal core audience. That’s the foundation you absolutely need before you can even think about scaling your reach.
Should I Delete Content That Performs Poorly?
The short answer? Almost never. That video that flopped isn't a failure—it's a dataset. Deleting it is like throwing away free research that could make your next post a hit.
Instead of hitting the delete button, put on your detective hat and treat it like a case study. Your job is to figure out why it didn't connect.
Ask yourself a few honest questions:
- Was the hook too slow or confusing?
- Did the topic completely miss the mark for who you're trying to reach?
- Was the editing style or format just a little... off?
Finding the answers to these questions will teach you more than analyzing a viral video ever could. The only time you should ever really consider removing content is if it contains flat-out wrong information or no longer reflects your brand's values. Otherwise, let it be a roadmap for what not to do next time.
Ready to turn these insights into videos that consistently connect? Hooked gives you a daily roadmap of viral trends and an AI video builder to help you create high-performing content in minutes. Stop guessing and start growing with a smarter, data-driven approach.